RSS

Category Archives: Project Management

Visual Presentation of Jira Information

I recently had the pleasure and privilege of presenting for the third time at Sharatoga Tech Talks. I previously talked about using Jira REST APIs to report on issue data outside of Jira. This time I expanded on that to present a technique for projecting a team’s workload for several software releases to help manage work and ensure on-time delivery.

When I read Edward Tufte’s excellent The Visual Display of Quantitative Information, I was impressed with his discussion of information density in great graphics. One of the many notable examples is Minard’s illustration of Napoleon’s failed Russian campaign, which, Tufte says, “may well be the best statistical graphic ever drawn.”

Among other information crammed into this graphic, the beige line shows advance and black lines show retreat with the width of the lines showing the declining strength of the force as it moved. The scale at the bottom shows the temperatures endured during the retreat.

There is a great deal of accessible and useful information in the book but my favorite of Tufte’s observations is, “Pie charts should never be used.” And yet, both Trac and Jira used pie charts for workload.

This chart leaves many unanswered questions. Are we on track to finish on time? Are any team members overworked? Can other team members take on some of their burden? Surely we can do better.

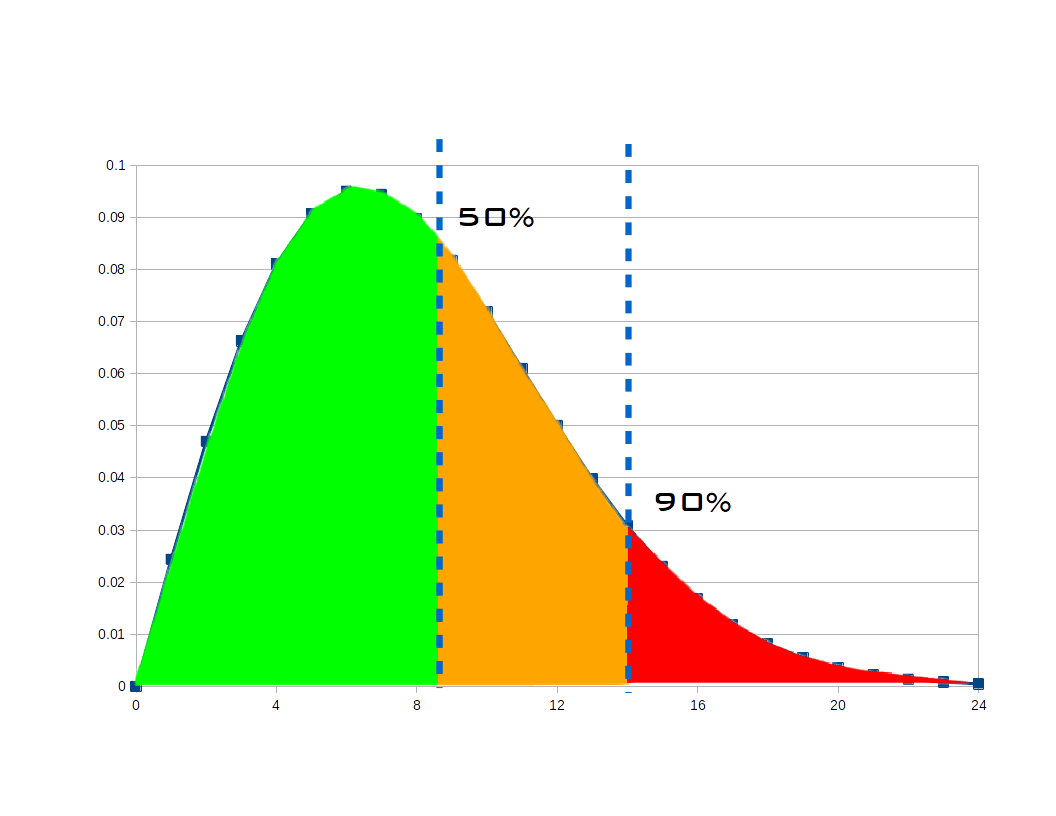
With a bar chart, we much more readily see the relative workloads of team members. Using a time scale for the Y axis allows us to see how much work each team member has. And knowing when the work is due and how fast work is usually completed, we can add a capacity threshold line showing how each member’s work compares to the amount likely to get done.

Long before reading Tufte, I had realized the low information density of pie charts and my development in Trac had included reworking Trac’s workload from pie charts to bar charts. Tufte inspired me to recreate and extend that work based on Jira data.

Release Workload

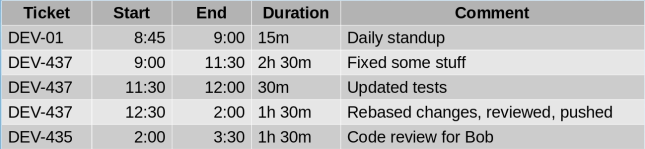
My Jira workload chart presents a lot of information in a small space.

  • the release this work is for
  • the date the work is due
  • the amount of work we can expect to complete by that date
  • the total number of hours due by that date
  • the total number of issues due by that date
  • the developers working on the release
  • the number of hours assigned to each developer
  • the number of issues assigned to each developer

Navigation

One of the things I love about Trac is that it is rich in crosslinks supporting drilling down to alternate views or more data. (Jira has links, too, but they don’t always go where I want or expect.) My workload chart follows this philosophy and clicking on different parts of the chart results in Jira issue search results showing the related issues:

  • Clicking on the release shows all the work in that release. (Because multiple releases may be due on the same date, each release leads to a different search result.)
  • Clicking on the date shows all the work due then. (If there are multiple releases on a date, clicking on the date shows all the work for all of the releases.)
  • Clicking on the bar or name for a developer shows all the work assigned to that developer.

Alternate Views

Looking at workload across the development team is useful but once we have the data, we can analyze it in other ways, too. A Kanban board shows how work progresses through stages and gives you an idea how close to done you are. By showing work by issue status we get the same result in a bar chart.

My workload chart can also show work by issue type (bug, enhancement, etc.) or project, measure work in hours or story points, and provide a default estimate for unestimated issues.

Projection

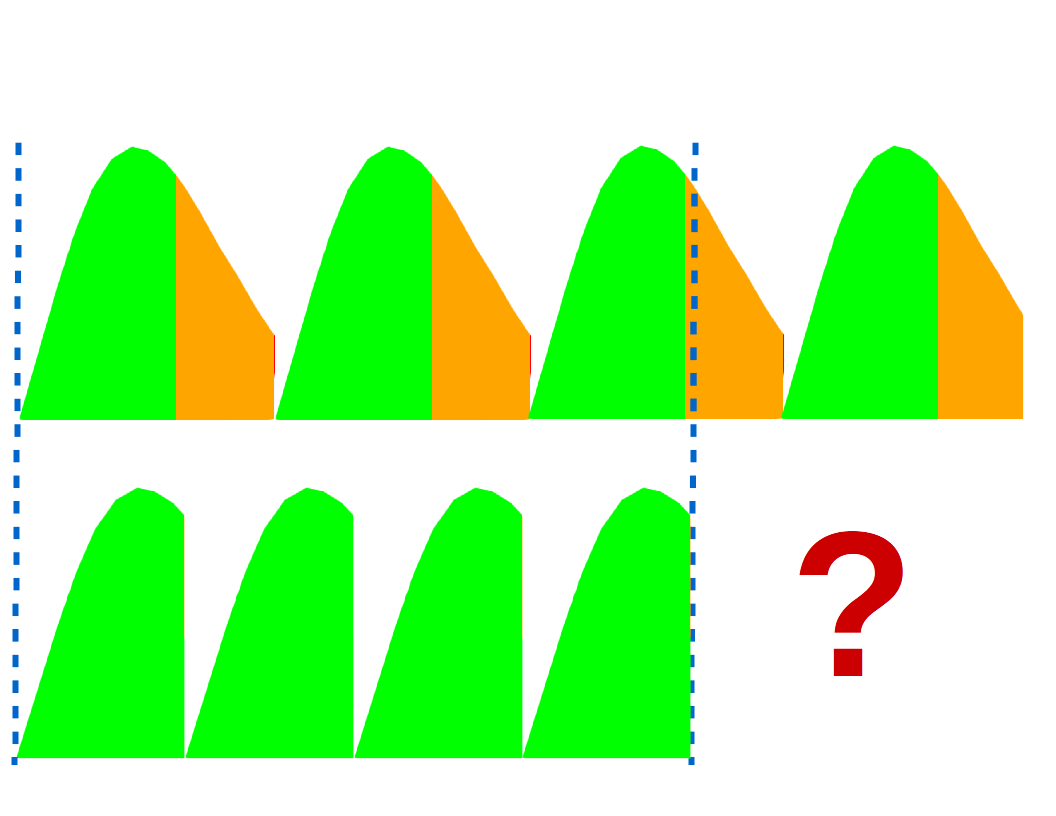
I find great value in an isolated workload chart for a single release or date but adding a time dimension and projecting workloads for future releases takes it to another level.

Let’s look at the workload for v1.0 again. You may think Marvin is a slacker. He doesn’t have much to do for v1.0 and you’d be tempted to see if he could help Daffy out.

But charting the next two releases tells a different story. Each chart includes all the work from the previous releases plus new work for the specific release. Marvin is still fairly lightly loaded for v1.0.1 and v1.1 but looking further we see that, starting now, Marvin is actually at risk for delivering all his work for release v1.2.

Now we know that to deliver v1.2 on time, we likely need to redistribute some of Marvin’s work. We can click through to see what makes up that workload and make informed decisions about redistributing it in a way that allows us to have confidence about the delivery of all of our planned releases.

Resources

 
Leave a comment

Posted by on December 3, 2019 in Project Management


Why Make an API You Can’t Use?

I like tools and process and in my software development work this has led to customizing tools to support very productive workflows for me and my team.  I’ve written before about How to Deliver Software On Time (or Know Early That You’ll be Late).

Since then a lot has changed in my work environment.  I’ve moved from developing for embedded Linux to developing for enterprise Windows.  I’ve changed from using Bash, C, and Python to using C#, PowerShell, and JavaScript.  And the tools supporting my workflow have changed from the integrated but extensible Trac system to the Atlassian suite (Confuence, BitBucket, and JIRA).  But reliable software delivery still relies on estimating your schedule and monitoring your progress.  I’ve found that JIRA falls somewhat short in supporting these needs and, worse, seems to try to prevent you from building better tools.

To monitor your software development progress, you have to

  1. Set an initial estimate
  2. Record work against that estimate
  3. Extract and analyze the work data

JIRA supports the first two steps moderately well.  When you create or edit a ticket you can set an Original Estimate or revise the Remaining Estimate.

Estimate Entry

In Trac, you can record time whenever you comment on a ticket.  JIRA separates comments and work log entries (which can also have a comment).  It is possible to view All Activity and see both, plus more, but I find that to be rather busy.  Still, you can record time and notes about what the time is for.

Log Work from Ticket

The “Date Started” defaults to now, which means you are recording what you are going to do for the next time period unless you manually update that field.

Unfortunately, just as the Atlassian suite has several different, incompatible ways to enter text, logging time has several different, incompatible ways to enter time.  In addition to the ticket-based method shown above, there is a time sheet gadget that allows you to log work quickly in a little popup.

Log work from Time Sheet

Fast, but wrong.  As in ticket-based time entry, the start time is now and you are logging time in the future.  You can fix that by clicking the “more options” link.  Strangely, this does not take you to the same dialog as entering time from a ticket.

Log Work detail from Time Sheet

Date, hour, minute, and AM/PM are separated into four fields.  Not such a big deal except there is some automation attempting to “validate” these values which in my experience not only sets them consistently wrong, but interferes with your ability to type in the right data.  (Pro tip: When in these fields Ctrl-A will highlight all of the text and then you can type in the right value.)

But if getting time tracking data into JIRA is frustrating, trying to get it out is infuriating. You can use JQL to get an overview of tickets matching a filter.  But unlike Trac’s query-based reports, you can’t control the format of the result.  Also, worklog details are not exposed to JQL so you can query for tickets you logged work in but not for the details of the work you logged.  In any individual ticket, you can view the Work log, which shows you who logged time, how much, and when, but you can’t filter that to see work logged in a time range.  And the timesheet gadget mentioned above will show you all the time you have logged in a week but it totals each ticket each day.

To keep track of my time, I want JIRA to answer the question “What did I just do?” with something like:

Prototype

As I said, JIRA doesn’t have reports but I have a couple of options if I want to customize the presentation of some data like this.  Like Trac, JIRA has a plugin architecture.  However, JIRA Cloud doesn’t allow custom plugins.  Like a lot of cloud software, JIRA Cloud has REST APIs to access its data.  While less integrated than a plugin, I should be able to write a little web app to get data with the JIRA APIs and display it with something like AngularJS.  Here I find myself amending one of the conclusions of my previous post to say that your tool needn’t be local and data-based (giving you free access to tables) if it is sufficiently open and API-based.

JIRA publishes an extensive API to access its data.  For my purposes, I need the results of a filter:

/rest/api/2/search?jql=filter=<filterNumber>

and the worklog details for a ticket:

/rest/api/2/issue/<ticketKey>/worklog

I said I should be able to write a little web app, but it was not that simple.  I prototyped my API usage with CURL

 curl -D- -X GET 
     -H "Authorization: Basic ..." 
     -H "Content-Type: application/json"
     https://xyz.atlassian.net/rest/api/...

and got the expected results, but the same headers and URL returned no data to JavaScript.  Turns out I was running into a browser security feature designed to combat cross-site scripting and prevent, say, a Facebook quiz from accessing your bank account with stored credentials.  However, having a web page or web-based application access multiple domains on the Internet is so useful that there is a protocol that allows it in a controlled way.

Cross-Origin Resource Sharing is supported by servers and enforced by browsers and uses a “pre-flight check” to negotiate what data an app can access.  Curl doesn’t enforce the limitations in CORS so my test worked fine, but Chrome enforces them strictly so my app wouldn’t work.

Actually, the problem is not that Chrome enforces CORS, but that JIRA Cloud doesn’t implement the server side of the protocol.  There is an open ticket about it (JRASERVER-59101) which Atlassian doesn’t seem to be in any hurry to address (thus the title of this post).  If you use JIRA Cloud, I urge you to click though that link and add your voice to those asking for it to be addressed.

Undeterred, I found a Chrome plugin that can relax rules in the browser in a controlled way.  With the Allow-Control, Allow-Origin plugin you can configure patterns of URLs for which CORS will be disabled.  When you install it you get a little green light in the tool bar and when you click that you can enable the plugin and configure patterns.

Extension

Because of the potential security hole this opens, each time you restart your browser you must enable the plugin and enter the URL(s) again but for me that’s a small price to pay.

With all of this in place, I was able to get the report I want.  I spent most of my time on function and not aesthetics but it does what I need.

sample2

From this I can tell I forgot to log some time between 9 and 9:15 and seem to have taken a half hour lunch. Monitoring this report during the day I have a chance to fill in gaps while I still remember what I did and my time tracking is much more accurate because of it.

If you’d find such a report useful, I’ve posted the code on GitHub.  Clone the repo, open the web page, fill in the fields and click Get time.  The license is GPL so use it and enhance it as you wish.  I’ll happily consider pull requests if you make it better.

 
Leave a comment

Posted by on September 24, 2017 in Project Management


Managing Software Projects Part 5: Monitoring and Feedback

This is the fifth and final part a series of posts on software project management. The series starts with Managing Software Projects Part 1: Tools. Start there to get the whole story.


Project completion is a moving target. The product manager wants to add features (without changing the delivery date, of course) and as you work on something that seemed simple, you realize you didn’t really understand it when you provided an estimate. Once in a while, you get surprised by how easy something turns out to be. And once you finish an early task, you know exactly how long it took. (If you’re doing high-risk/low-confidence tasks early, this transition from low confidence to perfect confidence makes your estimate better and better as the project proceeds.) To know early that you’ll be late, you have to continuously monitor progress.

Monitoring

As we work our Trac tickets, we record the time spent on the tasks. And if we’re bumping up against the estimate, we adjust it. Every night the Trac server runs a job that e-mails me the status of my active projects. It looks something like:

13083: Armstrong
   0.89 weeks work (buffered) will end 2015-06-15, due 2015-06-30 (d:/>)
   https://trac.net/trac/ticket/13083

Performance is in the form (p:tc)
   p is period: d=day, w=week, m=month
   t is trend: \=late, /=early, -=on time
   c is change (since last period): v=worse, >=even, ^=better  

Note that the projected completion is based on a buffered estimate that takes into account confidence. Also, the weeks of work is for the critical path so this isn’t staff time applied to the project; other things are proceeding in parallel and this is time to completion. In this case, we read the performance summary at the end of the line to say that since yesterday we haven’t changed our projection, we’re still ahead of schedule. If since yesterday you’d lost ground, you might see d:/v which says we used a little buffer but we’re still ahead of schedule.

Looking back

Continuous improvement means being better at something the second or third or 47th time you do it than you were during the previous iteration. You can only really accomplish this by looking back and saying, “What went wrong? What went right?” Agile folks call this a “retrospective,” a much more optimistic term than “post mortem!” Again, I have all my ticket data in a database so it’s relatively easy to get the system to tell me what happened. My retrospective report (a jumping off point for a group discussion of the project — or sprint — we just completed) looks something like:

57 tickets processed; 49 (85.96%) have estimates

Per-ticket accuracy
 min: -1  max: 378.6  avg: 15.43  sd: 73.28  median: 0.03
 under: 25  over: 24  exact: 0  u:o ratio: 1.04

Overall accuracy (tickets with estimates):
 est: 685.57  act: 1084.7  overall acc: 0.58

Overall accuracy (with default estimate, 8):
 est: 749.57  act: 1094.78  overall acc: 0.46

Project duration: 28 days.
Ticket open offset from start of project:
   Average: 0.00 (0.00% of dur.),  Weighted: 0.00 (0.00%).

Ticket start offset from start of project:
   Average: 5.3 (19% of dur.),  Weighted: 8.7 (31%).

Let’s go through it one item at a time.

On the first line we see roughly how big the project was. If you see a few hundred tickets, you probably need to think about making smaller, more understandable and manageable groups. Ideally, all of your tickets will have estimates. But small things slip in and sometimes it’s quicker to do a small, well-defined task than to do all the PM overhead. So we strive for a high percentage of tickets with estimates knowing it’ll never be 100%. I have a spreadsheet where I can trend these numbers from project to project so I know if we’re getting lazy and not estimating as much as we used to.

There are many ways to slice and dice estimate accuracy (by code base, by estimator, by ticket type, etc.) but here we just look at it by project. I developed the accuracy metric we live by and find that it provides intuitive insight into accuracy. The formula I use is

(actual time - estimated time) / estimated time

.
This has some useful properties.

  • A number less than zero indicates that the task was underestimated (took longer than anticipated); the negative sign has the connotation of “bad.”
  • On the other hand, a number greater than zero indicates that the task was overestimated (took less time than expected). While this is good for the delivery date, it’s still “wrong” in the sense that the actual time doesn’t match the estimate.
  • The magnitude of the accuracy is how close you were. Frankly, I find -0.1 (it took 10% longer than expected) a “better” estimate than 2 (it took half as long as expected).

The per-ticket accuracy section is the result of computing the accuracy for each ticket then running some statistical functions over the results. Here the median accuracy is pretty close to zero, the ideal. Remember that in CCPM, your goal is to give an estimate that you are as likely to be under as over. If we look at the next line we see that of the 49 tickets estimated they are almost exactly half underestimated and half overestimated. You really can’t do much better than that.

The next section computes the accuracy for the project as a whole (the total time applied vs. the total time originally estimated). Here we see that we ran over (positive accuracy) but it wasn’t horrible (magnitude less than 1).

Next, we consider if we applied our historical average time per ticket to the unestimated tickets, how good was our estimate? Here we get a little closer to zero, which is reassuring.

The next couple of sections relate to how well the project scope was managed and how good the code produced was. In an ideal project all the tickets exist at the start and are scheduled out through the course of the project. But if scope creeps, feature tickets get added during the project. And if the code isn’t very good, tests produce bug tickets late in the project. We compute this offset based on ticket counts (the first number) and hours of work in the tickets (the weighted number). This report illustrates a very successful project with no tickets added after the outset.

We also look at when work on tickets was started relative to the start of the project. In an ideal project, work would be done at at steady pace throughout the project so the median start would be at the half-way point. A project with a long tail of pernicious issues after major development will tend to have that the average start earlier than 50%. A rush of development late in the project will move the median above the mid point. Both scenarios may reflect poor project management and low quality.

Takeaways

So, what can you take away from several weeks of talking about better software project management?

  • Use data-based tools; they allow you to analyze your project performance to monitor how you are doing and reflect on how you did.
  • Make your tasks small; breaking down big tasks into smaller ones enhances your understanding of scope.
  • Schedule high-risk tasks early; that’s the only way you can know early if you’ll be late.
  • Bundle uncertainty in a project buffer, not in a pad to every task’s estimate.
  • Monitor progress so you are not surprised when you approach your deadline with no chance of meeting it.
  • Use experience to fine tune your future estimates and assumptions.

Project management is a bit of an art but a bit of care can make it more predictable.

 
2 Comments

Posted by on September 28, 2015 in Project Management


Tags: ,

Managing Software Projects Part 4: Estimating completion

This is part 4 of a series of posts on software project management. The series starts with Managing Software Projects Part 1: Tools. Start there to get the whole story.


“No battle plan survives contact with the enemy.” — Helmuth von Moltke

The Gantt chart, the work breakdown, and task estimates, especially, are dynamic; they change throughout the life of a project. So, how do you plan for change in a way that allows you to still meet your deadline? Francis Patrick proposes Critical Chain Scheduling and Buffer Management. It’s worth reading the whole paper but I’ll give my take on it here.

What Patrick is trying to do is avoid both Parkinson’s Law (Work expands to fill the time allotted) and Student Syndrome (Everything gets done at the last minute) by pushing the pad — or buffer — to the end of the project.

Task Estimates

When you ask a developer for an estimate, he or she will give you a number but the time it takes to perform a task is really a point on a distribution. You can visualize this as a Weibull distribution like the one below. The area under the curve is 1 unit and you can read the chart as meaning the area to the left of a vertical line is the probability of the task being done by that time on the x axis.

Estimate Distribution

Developers like to meet their deadlines so they are likely to give you a number that they are fairly confident accounts for some things going wrong. Consider the right line on the chart and see that there’s a 90% chance the task would be done in approximately 14 hours. That’s the kind of number you usually plan around. But if you have a bunch of tasks, errors will tend to cancel: some will take more time than expected, some will take less. What if we planned around estimates that we were as likely to be under as over? That is the 50% line in the chart. That’s about 8.5 hours instead of 14, a big improvement.

Compressed Schedule

Project Buffer

When you string together several tasks, using the 50% confidence estimate shortens the schedule considerably. But I mentioned a buffer before. We want to add a little bit of a pad after the estimated completion of the last task and use that padded duration to set our project deadline. We could add a flat 30% or something but since we have a lot of data to work with and a computer is figuring it out for us, we can do better.

  • Compute the buffer
    • Find critical path
    • Total estimates
    • Compute weighted confidence
    • Buffer = total estimate * f(weighted confidence)
  • Compute project makespan
    • Makespan = estimate + buffer
  • Figure out when you’ll finish
    • Project finish = Project start + Makespan

Note that nowhere in this calculation have we assigned due dates for the individual tasks in the project. The tasks are ordered based on the schedule with the intention that the first task should be started now, the next as soon as that’s done, etc. This tends to avoid the procrastination that arises from thinking “This 1-day task isn’t due until next week, so I don’t need to start it now.” If you wait to start and then realize you underestimated, you may not be able to finish on time.

Example

As an example of calculating and using a buffer, let’s look at the project from Part 2.

Task Estimate Confidence Value
1.0 Develop UI 90 hours Medium-High 2.39

Patrick has some academic idea of how much buffer you should have. The specifics are hidden behind the f(confidence) in the outline above. I feel it is really specific to your team, experience, business, etc. The function can be linear, exponential, or something more complicated as fits your need.

Buffer Functions

If we use the binary curve from the figure, we determine the buffer multiplier by going across the x axis to find 2.39, go up to the curve, then go left to find the multiplier on the y axis, in this case around .8. Our buffer is (.8 * 90) = 72, and the project makespan would be (90 + 72) = 162 hours. If you assume your developers get 30 productive hours in each week (allowing for meetings and other distractions), that suggests the UI would be done 5.4 weeks after work on it begins.

Next

In the next post, I’ll discuss monitoring the progress of your project.

 
2 Comments

Posted by on September 21, 2015 in Project Management


Tags: ,

Managing Software Projects Part 3: Scheduling

This is part 3 of a series of posts on software project management. The series starts with Managing Software Projects Part 1: Tools. Start there to get the whole story.


When you are heading out to run errands, it’s not too hard to figure out in what order you will go to the cleaners and the gas station and the grocery store but such intuitive scheduling doesn’t scale well. With dozens of tasks being done by a handful of people, you really want a computer to do the heavy lifting.

As I started working on automatic scheduling of Trac tickets, I did a bit of research and found that this is what academics call the Resource Constrained Project Scheduling Problem. A resource can be anything from a developer’s time to the capacity of a roadway. Your project schedule can’t exceed the constraints imposed by the availability of the resource. Your developer can’t work 25 hours a day and a one-lane dirt road can only accommodate so many cement trucks at a time.

Digging deeper, I found that academics have reference projects and their research is into how to efficiently find the best (usually shortest) schedule for a fixed set of activities and resources. In the end, they are talking about squeezing a few percent out of the time it takes to complete a project. Software project scheduling — at least as I practice it — is very different. The set of tasks is dynamic and the margin of error in the estimates is often 100%. Clearly rigorous academic thinking was not what I was looking for.

My research did turn up a useful technique, however. Several areas of research revolved around a Serial Schedule Generation Scheme. At it’s simplest, SSGS is straightforward and easy to implement; I’ve done it twice in Python and once in Perl. The basic idea is:

  • Find eligible tasks
    • No incomplete predecessors
    • Resource is available
  • Sort eligible tasks
    • Bugs before enhancements
    • High risk before low
    • Fragile code base before stable
  • Schedule one task
  • Find more eligible
  • Repeat at Sort

Like many templates, this one gets its power and flexibility from being able to customize steps.

The scheduler in TracPM gets resource availability from an implementation of IResourceCalendar.

class IResourceCalendar(Interface):
    # Return the number of hours available for the resource
    # on the specified date.
    def hoursAvailable(self, date, resource = None):
        """Called to see how many hours are available on date"""

The IResourceCalendar implementation in Team Calendar returns 0 or 8 based on whether the developer is in or out that day but more flexible calendars could return, for example, 4 hours per day for a developer who is only available half time.

The scheduler sorts tasks with an implementation of ITaskSorter:

class ITaskSorter(Interface):
    # Process task list to precompute keys or otherwise make
    # compareTasks() more efficient.
    def prepareTasks(self, ticketsByID):
        """Called to prepare tasks for sorting."""

    # Provide a compare function for sorting tasks.
    # May be used as cmp argument for sorted(), and list.sort().
    # Returns -1 if t1 < t2.
    def compareTasks(self, t1, t2):
        """Called to compare two tasks"""

TracPM includes a simple sorter but I use a small, in-house plugin that expresses our business rules.

Critical Path

The really interesting work in a project occurs on the critical path. The critical path is interesting because any delay in completing a task on the CP delays the completion of the project. That explanation doesn’t lead to a natural or obvious means of finding those tasks but I did turn up a brute force algorithm that works quite well for dozens or hundreds of tasks:

  • Starting now, compute the ASAP schedule
  • Starting at the end of the ASAP schedule, compute ALAP schedule
  • Find tasks that have the same start and finish time in both schedules

Next Time

In my next post, I’ll explore using the critical path tasks and task estimates to estimate project completion.

 
1 Comment

Posted by on September 14, 2015 in Project Management


Tags: , ,

Managing Software Projects Part 2: Techniques

This is part 2 of a series of posts on software project management. The series starts with Managing Software Projects Part 1: Tools. Start there to get the whole story.


Jeff Atwood has noted, “On our project we’re always 90% done.” That phenomenon arises from not having a checklist of remaining work (or from having items on your list that are too big to really track).

Create Small Tasks

Smaller tasks allow for better estimates and being 100% done on 9 of 10 tasks is more accurate than being 90% done on one task. Consider developing a new app. Early in the project, you might have an item like:

Task Estimate
Develop UI 80 hours

And that’s fine for an initial plan, but it’s too big and too vague to implement. So, thinking about it more, you might get to:

Task Estimate
1.0 Develop UI 90 hours
  1.1 Develop API 30 hours
  1.2 Develop Icons 10 hours
  1.3 Develop CLI 15 hours
  1.4 Develop Web UI 15 hours
  1.5 Develop App 20 hours

I’d argue that the 30-hour and 20-hour items need to be broken down more but look what else has happened: by itemizing parts you added 10 hours to the estimate for the UI. You understand it better and you have a more accurate picture of the scope. If you did this immediately after project approval, you’d know early that you had estimated low.

Do High-Risk Tasks ASAP

The risk of delivering all the intended features or meeting your planned schedule is highest at project inception. If you are doing something novel — developing a new algorithm, working with a new widget set — you don’t yet know if it’ll take a day, a week, or a month. That risk can be reflected in assigning a low confidence to the estimate for the novel task.

You might also consider that a task that has not yet been broken down into bite-sized subtasks is risky because you don’t know what you’ll discover as you refine the task. Or you may know that one member of your team is always optimistic. Whatever the source of risk, you want to drive it out of your project as quickly as possible by scheduling high-risk tasks as early as possible. Once they are done, you have a much higher confidence in the remaining, lower-risk plan.

Task Estimate Confidence
1.0 Develop UI 90 hours
  1.1 Develop API 30 hours Medium
  1.2 Develop Icons 10 hours High
  1.3 Develop CLI 15 hours Very High
  1.4 Develop Web UI 15 hours High
  1.5 Develop App 20 hours Low

Confidence Levels

While “high” may be attractive for being intuitive, it’s hard to manipulate. How can we sort the low-confidence tasks before high-confidence ones? What is the overall confidence in the estimate for the UI task? Since we’re storing our project tasks in a database and manipulating them with code, we can assign numeric values behind the scenes.

Confidence Value
Low 1
Medium 2
High 3
Very High 4

It is no accident that there are an even number of choices. When given an odd number of choices, people tend to pick the middle value. By not having a middle choice, users are nudged to think a little harder about how confident they are in their estimate.

For completeness, my system has two more values, one on each end.

  • A task may have no confidence selected and we use 0 to indicate “very low.”
  • A task may be complete, in which case we use 5 to indicate we have perfect confidence that the actual hours worked is how long it took.

Using Confidence Levels

Task Estimate Confidence Value
1.0 Develop UI 90 hours
  1.1 Develop API 30 hours Medium 2
  1.2 Develop Icons 10 hours High 3
  1.3 Develop CLI 15 hours Very High 4
  1.4 Develop Web UI 15 hours High 3
  1.5 Develop App 20 hours Low 1

By taking the average of the confidence values weighted by the number of hours in each task, we can answer the question from above: how much confidence do we have in that 90-hour estimate?

((30*2) + (10*3) + (15*4) + (15*3) + (20*1)) / 90 = 2.39

Looking up 2.39 in the table of values, we can say we have Medium-High confidence in that estimate.

Next Time

In my next post, I’ll talk about scheduling tasks based on your business rules.

 
3 Comments

Posted by on September 8, 2015 in Project Management


Tags: , , ,

Managing Software Projects Part 1: Tools

Recently, I had the pleasure of presenting at Sharatoga Tech Talks on “How to deliver software on time (or know early that you’ll be late).” I’ve posted the slides but they lack a lot of narrative so in my next few posts I’ll paraphrase a lot of what I said that night.

Software projects have a reputation for running late, perhaps second only to government projects. (A government software project? Fuggettaboutit!) But if something as complex as the World Trade Center can be completed on schedule, what is my excuse? I’ve never worked on a software system as complex as that must have been! (The construction of One World Trade Center finished two years after the original plan but the start of the project was delayed by two years so once they got going, the project took the ten years they had originally projected. To me that is on schedule.)

I’m not a PMP but I do have three decades’ experience developing software and a reputation at my company for delivering projects on time (or, as I hinted in my presentation title, knowing early when I’ll be late so management can plan around the delay). What I’m saying here isn’t project management gospel, just things that work for me. I hope you see some benefit in them.

Tools

I’m not fan of Microsoft Project — though admittedly, that’s what the big boys use on projects like the World Trade Center — but it does provide tools that are handy whatever software you are using to manage your project.

  • Work Breakdown Structure organizes a project into a hierarchy of progressively smaller subtasks until the lowest level is something you can actually understand and complete
  • Gantt Charts show the relationships between tasks, what has to be done first, what that task completion enables, and so on
  • Project Calendars track the availability of resources (e.g., when your developers are on vacation)

All the cool kids are using Agile methods to develop software and that paradigm introduces other tools to help track projects.

  • Workload charts show how work is divided among team members
  • Burndown charts show how work is progressing

And I find it very helpful to have access to my project data in a database for ad hoc queries and reports.

Open Source Tools

I manage my projects in a souped-up installation of Trac. The basic system provides a ticketing system and a wiki but it has a very flexible and capable plugin architecture that allows you to customize it.

Trac-Hacks is a public repository of plugins including:

  • Timing & Estimation provides fields to record estimates and work
  • Estimation Tools provides workload and burndown charts
  • Master Tickets supports Finish-Start dependencies
  • Subtickets supports Work Breakdown Structure
  • Team Calendar allows team members to indicate when they’ll be out
  • TracJSGantt provides an incredible Gantt chart based only on <div> tags and CSS rules

The TracJSGantt plugin has grown to include support for more project management functions like scheduling in a TracPM subsystem.

Trac Requirements

Trac is written in Python and runs on Linux, OS X, or Windows. It requires an RDBMS to store its data. You can use the SQLite bundled with the distribution but that isn’t really suitable for more than a couple of users. You can use MySQL or PostgreSQL as you prefer. I work on Linux with PostgreSQL and while I try to be platform-agnostic, no doubt some OS- or DB-specific code has crept into my scripts.

Next time

In part 2, I’ll talk about some project management techniques.

 
5 Comments

Posted by on August 31, 2015 in Project Management


Tags: , , ,