I like tools and process and in my software development work this has led to customizing tools to support very productive workflows for me and my team. I’ve written before about How to Deliver Software On Time (or Know Early That You’ll be Late).
Since then a lot has changed in my work environment. I’ve moved from developing for embedded Linux to developing for enterprise Windows. I’ve changed from using Bash, C, and Python to using C#, PowerShell, and JavaScript. And the tools supporting my workflow have changed from the integrated but extensible Trac system to the Atlassian suite (Confuence, BitBucket, and JIRA). But reliable software delivery still relies on estimating your schedule and monitoring your progress. I’ve found that JIRA falls somewhat short in supporting these needs and, worse, seems to try to prevent you from building better tools.
To monitor your software development progress, you have to
- Set an initial estimate
- Record work against that estimate
- Extract and analyze the work data
JIRA supports the first two steps moderately well. When you create or edit a ticket you can set an Original Estimate or revise the Remaining Estimate.

In Trac, you can record time whenever you comment on a ticket. JIRA separates comments and work log entries (which can also have a comment). It is possible to view All Activity and see both, plus more, but I find that to be rather busy. Still, you can record time and notes about what the time is for.

The “Date Started” defaults to now, which means you are recording what you are going to do for the next time period unless you manually update that field.
Unfortunately, just as the Atlassian suite has several different, incompatible ways to enter text, logging time has several different, incompatible ways to enter time. In addition to the ticket-based method shown above, there is a time sheet gadget that allows you to log work quickly in a little popup.

Fast, but wrong. As in ticket-based time entry, the start time is now and you are logging time in the future. You can fix that by clicking the “more options” link. Strangely, this does not take you to the same dialog as entering time from a ticket.

Date, hour, minute, and AM/PM are separated into four fields. Not such a big deal except there is some automation attempting to “validate” these values which in my experience not only sets them consistently wrong, but interferes with your ability to type in the right data. (Pro tip: When in these fields Ctrl-A will highlight all of the text and then you can type in the right value.)
But if getting time tracking data into JIRA is frustrating, trying to get it out is infuriating. You can use JQL to get an overview of tickets matching a filter. But unlike Trac’s query-based reports, you can’t control the format of the result. Also, worklog details are not exposed to JQL so you can query for tickets you logged work in but not for the details of the work you logged. In any individual ticket, you can view the Work log, which shows you who logged time, how much, and when, but you can’t filter that to see work logged in a time range. And the timesheet gadget mentioned above will show you all the time you have logged in a week but it totals each ticket each day.
To keep track of my time, I want JIRA to answer the question “What did I just do?” with something like:
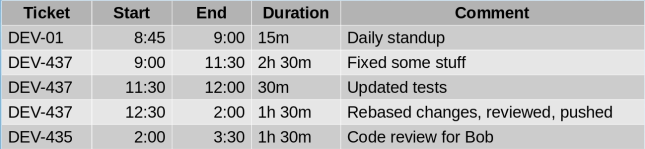
As I said, JIRA doesn’t have reports but I have a couple of options if I want to customize the presentation of some data like this. Like Trac, JIRA has a plugin architecture. However, JIRA Cloud doesn’t allow custom plugins. Like a lot of cloud software, JIRA Cloud has REST APIs to access its data. While less integrated than a plugin, I should be able to write a little web app to get data with the JIRA APIs and display it with something like AngularJS. Here I find myself amending one of the conclusions of my previous post to say that your tool needn’t be local and data-based (giving you free access to tables) if it is sufficiently open and API-based.
JIRA publishes an extensive API to access its data. For my purposes, I need the results of a filter:
/rest/api/2/search?jql=filter=<filterNumber>
and the worklog details for a ticket:
/rest/api/2/issue/<ticketKey>/worklog
I said I should be able to write a little web app, but it was not that simple. I prototyped my API usage with CURL
 curl -D- -X GET
     -H "Authorization: Basic ..."
     -H "Content-Type: application/json"
     https://xyz.atlassian.net/rest/api/...
and got the expected results, but the same headers and URL returned no data to JavaScript. Turns out I was running into a browser security feature designed to combat cross-site scripting and prevent, say, a Facebook quiz from accessing your bank account with stored credentials. However, having a web page or web-based application access multiple domains on the Internet is so useful that there is a protocol that allows it in a controlled way.
Cross-Origin Resource Sharing is supported by servers and enforced by browsers and uses a “pre-flight check” to negotiate what data an app can access. Curl doesn’t enforce the limitations in CORS so my test worked fine, but Chrome enforces them strictly so my app wouldn’t work.
Actually, the problem is not that Chrome enforces CORS, but that JIRA Cloud doesn’t implement the server side of the protocol. There is an open ticket about it (JRASERVER-59101) which Atlassian doesn’t seem to be in any hurry to address (thus the title of this post). If you use JIRA Cloud, I urge you to click though that link and add your voice to those asking for it to be addressed.
Undeterred, I found a Chrome plugin that can relax rules in the browser in a controlled way. With the Allow-Control, Allow-Origin plugin you can configure patterns of URLs for which CORS will be disabled. When you install it you get a little green light in the tool bar and when you click that you can enable the plugin and configure patterns.

Because of the potential security hole this opens, each time you restart your browser you must enable the plugin and enter the URL(s) again but for me that’s a small price to pay.
With all of this in place, I was able to get the report I want. I spent most of my time on function and not aesthetics but it does what I need.
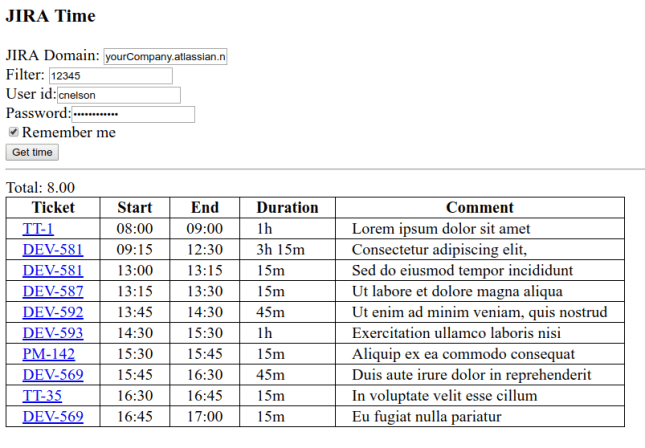
From this I can tell I forgot to log some time between 9 and 9:15 and seem to have taken a half hour lunch. Monitoring this report during the day I have a chance to fill in gaps while I still remember what I did and my time tracking is much more accurate because of it.
If you’d find such a report useful, I’ve posted the code on GitHub. Clone the repo, open the web page, fill in the fields and click Get time. The license is GPL so use it and enhance it as you wish. I’ll happily consider pull requests if you make it better.